


Power Savers
Overview
An application designed to track and monitor users' daily energy consumption, encouraging them to make informed choices for a sustainable future.
Role
UX/UI Designer
User Research, Interaction, Visual design, Prototyping & Testing
Tools
Figma, FigJam, Miro, Trello
Project Overview
Power Savers is an electricity tracking application designed to monitor the user’s everyday power usage. It goes beyond mere tracking, creating a vibrant social platform where users can share their energy-saving journey, inspire each other, and earn rewards for their progress. Power Savers makes saving electricity not just a personal goal, but a collective effort towards a more sustainable future.
Problem Statement
Individuals struggle to effectively monitor and manage their electricity consumption due to the lack of intuitive tools, resulting in excessive usage and a failure to leverage energy-saving opportunities, ultimately leading to wasted energy. This emphasizes the necessity for an innovative electricity tracking app that not only accurately records daily power usage but also provides customized recommendations, fosters social interaction, and offers incentives to encourage users to conserve energy and promote environmental sustainability.

Possible Solution
Power Savers is an energy-tracking application crafted to revolutionize how users monitor their energy usage. It introduces an innovative and interactive approach to monitoring consumption, employing visual tools for clarity. Additionally, it features a dynamic social platform for users to share their progress and offers incentives for energy conservation. This solution not only aids in reducing electricity consumption and saving costs but also fosters a sense of fulfilment by contributing to environmental benefits.

The Lean UX Process
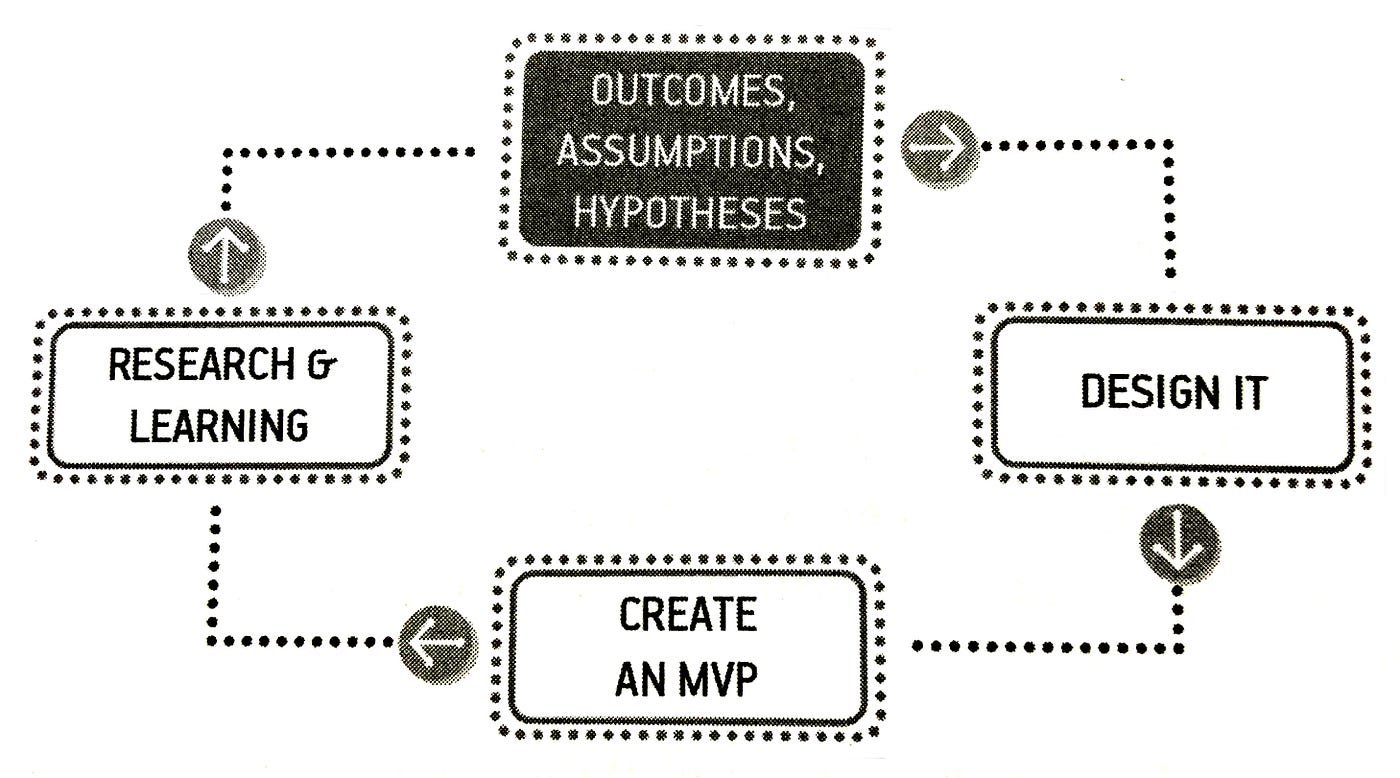
Sprint 1

Lean UX: Problem Exploration and Hypothesis Building
The Motivation
The rise of “Work from home” has led to an increasing amount of fossil-heavy electricity usage. According to Geoscience Australia (2022), Coal is yet the main source of energy within Australia, responsible for 40% of energy-related emissions. The effect of this can be seen in the effects of climate change such as rising temperatures, shifting rainfall patterns and rising sea levels.
Existing applications and hardware electric products provide users with information on electricity usage, meter readings, and bill payment schedules. However, this data is often obscured by technical jargon, making it difficult for users to grasp it quickly and effectively. It's crucial to find new ways to convey the importance of energy conservation, ensuring that electricity readings are presented in ways that engage and are easily understood by the community. This, in turn, can motivate behavioural changes aimed at saving electricity.
User Assumption
The prolonged period of staying at home and work-from-home culture, prompted by the aftermath of the pandemic, has led to a noticeable surge in individual electricity consumption. Therefore, the assumption is that:
"For those conscious of the environment, the rise in energy consumption is a concern. Nonetheless, various obstacles hinder their ability to effectively monitor their energy use. This leads to excessive resource consumption and high bills.
Main Hypothesis
Rising global warming necessitates individuals to be environmentally responsible, monitoring their energy usage and carbon footprint. This app aids users in tracking daily, weekly, and monthly electricity consumption in their homes and allows them to share their energy savings on the app's social portal.
Additionally, this app aims to influence users' behaviour, making them more aware of their energy usage. It offers incentives such as vouchers and encourages users to motivate each other towards building a more sustainable world.
Sprint 2

'The Team', 'The Measurement', and 'The Process.'
Approach
Our approach to creating a Minimum Viable Product (MVP) involved strategically assigning roles among team members. A cross-functional team of six embarked on this journey by understanding the problem space and creating a solution. We began with a comprehensive workshop where we identified the problem space, project aims, objectives, and user needs. Each team member contributed various design ideas, which we then discussed and refined as a group. We followed this with rapid prototyping. Lightweight mockups were tested iteratively with potential users to validate assumptions. Weekly stand-ups ensured alignment and quick decision-making. We used collaborative tools throughout the process for seamless communication and documentation. Regular retrospectives allowed us to reflect on our processes and foster continuous improvement.
Constant communication was pivotal in meeting weekly milestones and crafting an MVP. It kept us aligned, addressed challenges promptly, and ensured focused efforts on delivering a viable product. By fostering open communication, decision-making was streamlined, leading to successful MVP development within project constraints.
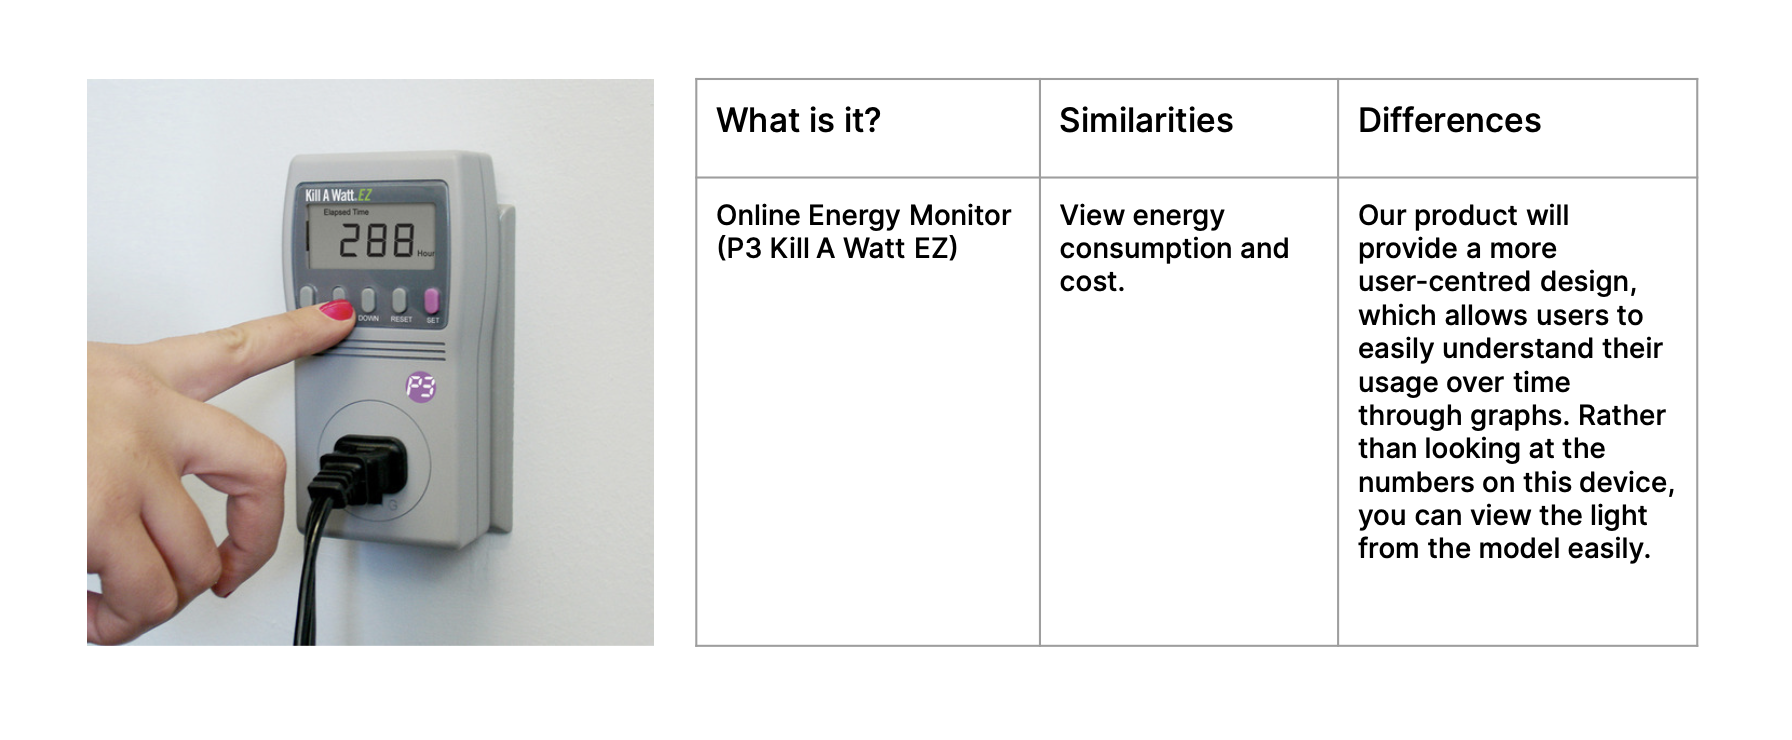
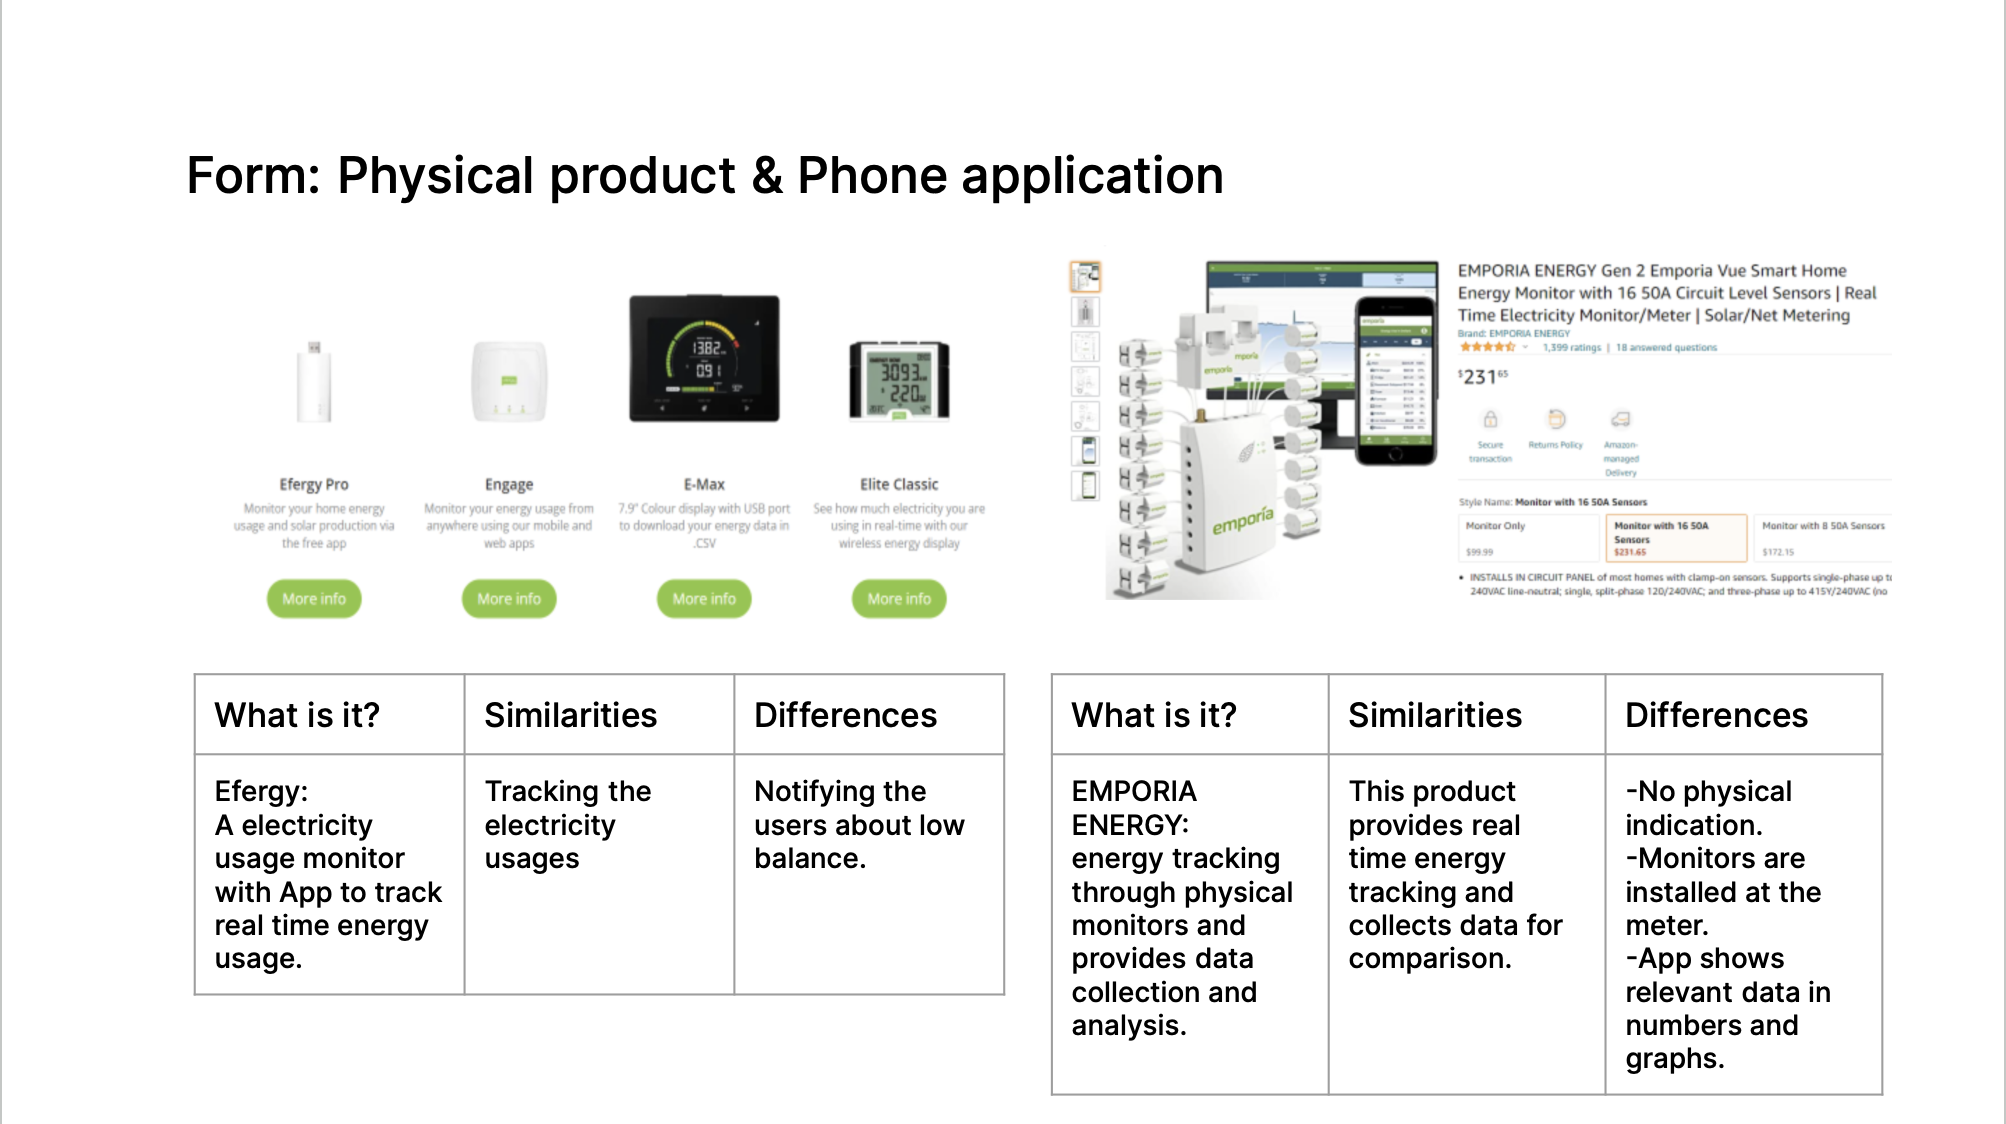
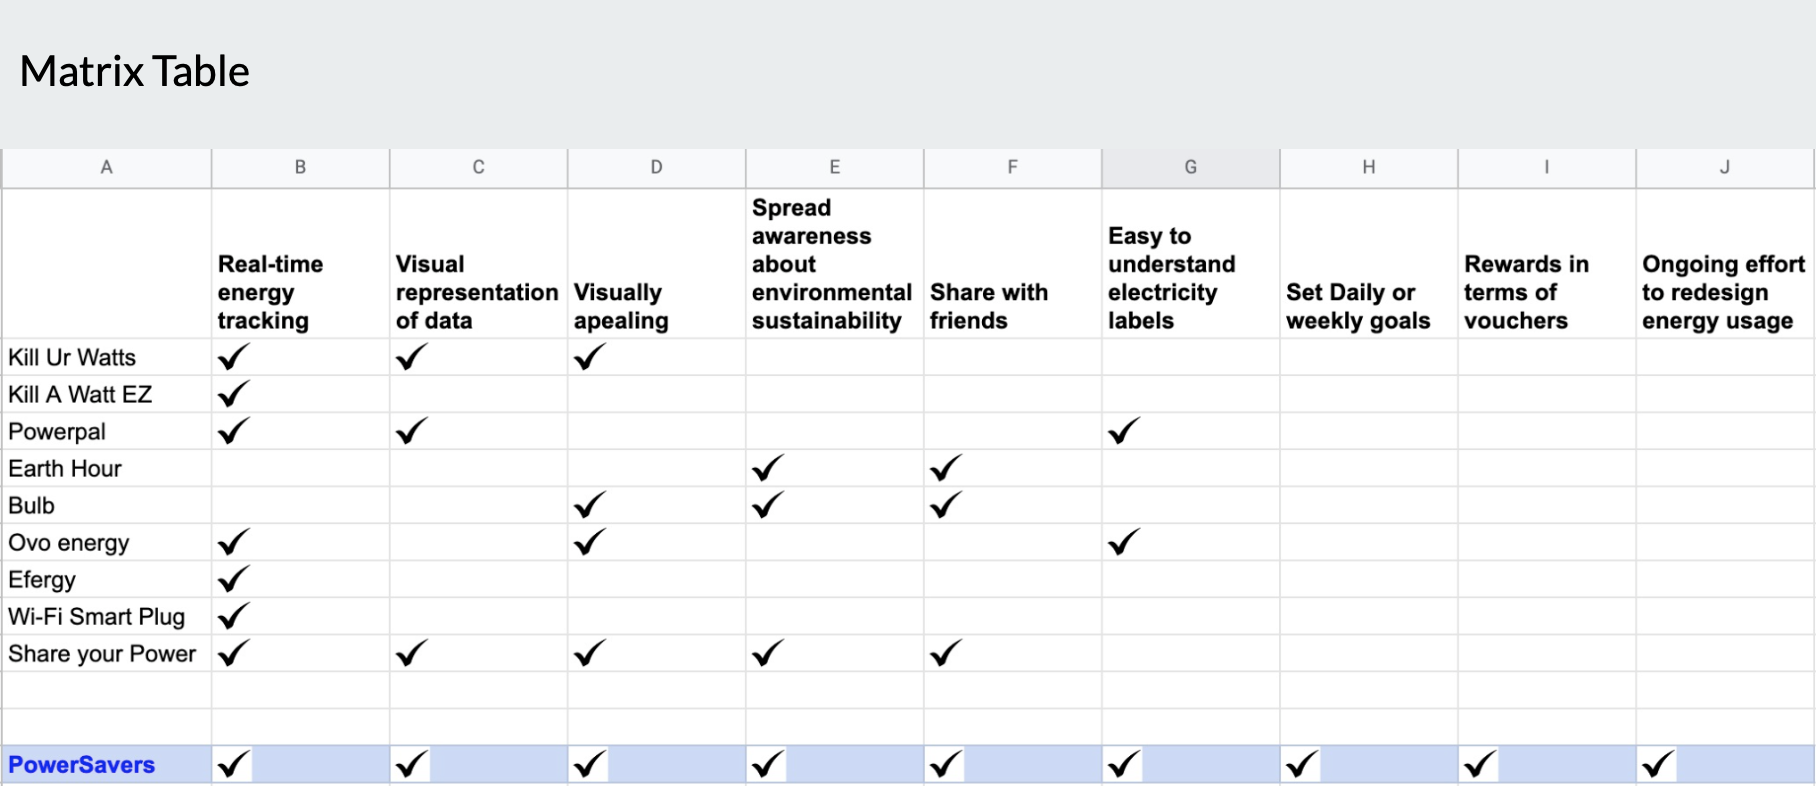
'Comparative Analysis
In our iterative process, subsequent sprints were dedicated to analyzing existing apps and products in the market, based on our assumptions and the identified problem space. To conduct a thorough comparative analysis, we meticulously examined various reference products. This involved creating a comparative matrix to identify similarities across the market and potential unique selling points for our proposed product. Our detailed matrix outlined key aspects and functions of each reference product alongside our own, facilitating a comprehensive analysis.
Reference Products
Form: Physical product
Form: Physical product & Phone application
Form: Global movement

Form: Physical prototype

Form: Phone application

Form: Phone application

Form: Form: Physical product & Phone application

➡️ Based on the analysis, the conclusions drawn are:
It's often challenging to visualize what the technical figures imply about carbon emissions and scale for most physical products.
The emphasis is on the financial aspect rather than on monitoring the user's environmental impact.
None of the existing apps or products incorporate a social element that fosters a sense of community and motivates users to conserve resources.
Defined Problem Statement
Our Electricity Tracker Application is designed to track the user's daily electricity usage innovatively, create a social portal for sharing progress, and motivate and incentivize them to save energy.
Our solution enables our customers to achieve greater success. This is measured through reduced electricity usage, increased satisfaction, frequency of app interaction, and the amount of savings donated.
Sprint 3

Design Iteration and Vision
Persona Development
User personas were created to understand the users' needs, experiences, behaviour, and pain points.


Ideation, Sketch and Workshop Ideas
During the initial brainstorming phase, we created some basic sketches to visualize the solution more clearly. These sketches helped us determine the key features we wanted to include and how they would be integrated into the final design.

Wireframes
Basic wireframes were created for segments of the solution to gain a better understanding of the process and the flow of the app.

Moving forward, we continued the ideation process and designed key screens of the app, including the Home screen and the Energy Tracking screens.
Home Screens Ideation

Energy Tracking Ideation

Mid-Fi Prototype
We advanced to the mid-fidelity prototype stage, incorporating further ideation and feedback from the usability tests. These mid-fidelity prototypes were then utilized to conduct a field study of the proposed solution.
Account Creation

Room Selection

Home Screen
Energy Tracking & Comparison

Social Element
Field Study
As part of our field study, we conducted interviews with 12 participants aged 25 and above with a broader climate-conscious mindset. The aim was to explore their energy usage habits, their awareness of energy consumption, and the challenges they face in their efforts to be environmentally conscious.
After analyzing the interview data, we compiled our significant findings on a Miro board. This approach aimed to better understand and organize all our interview data to gather the key insights from the interviews.
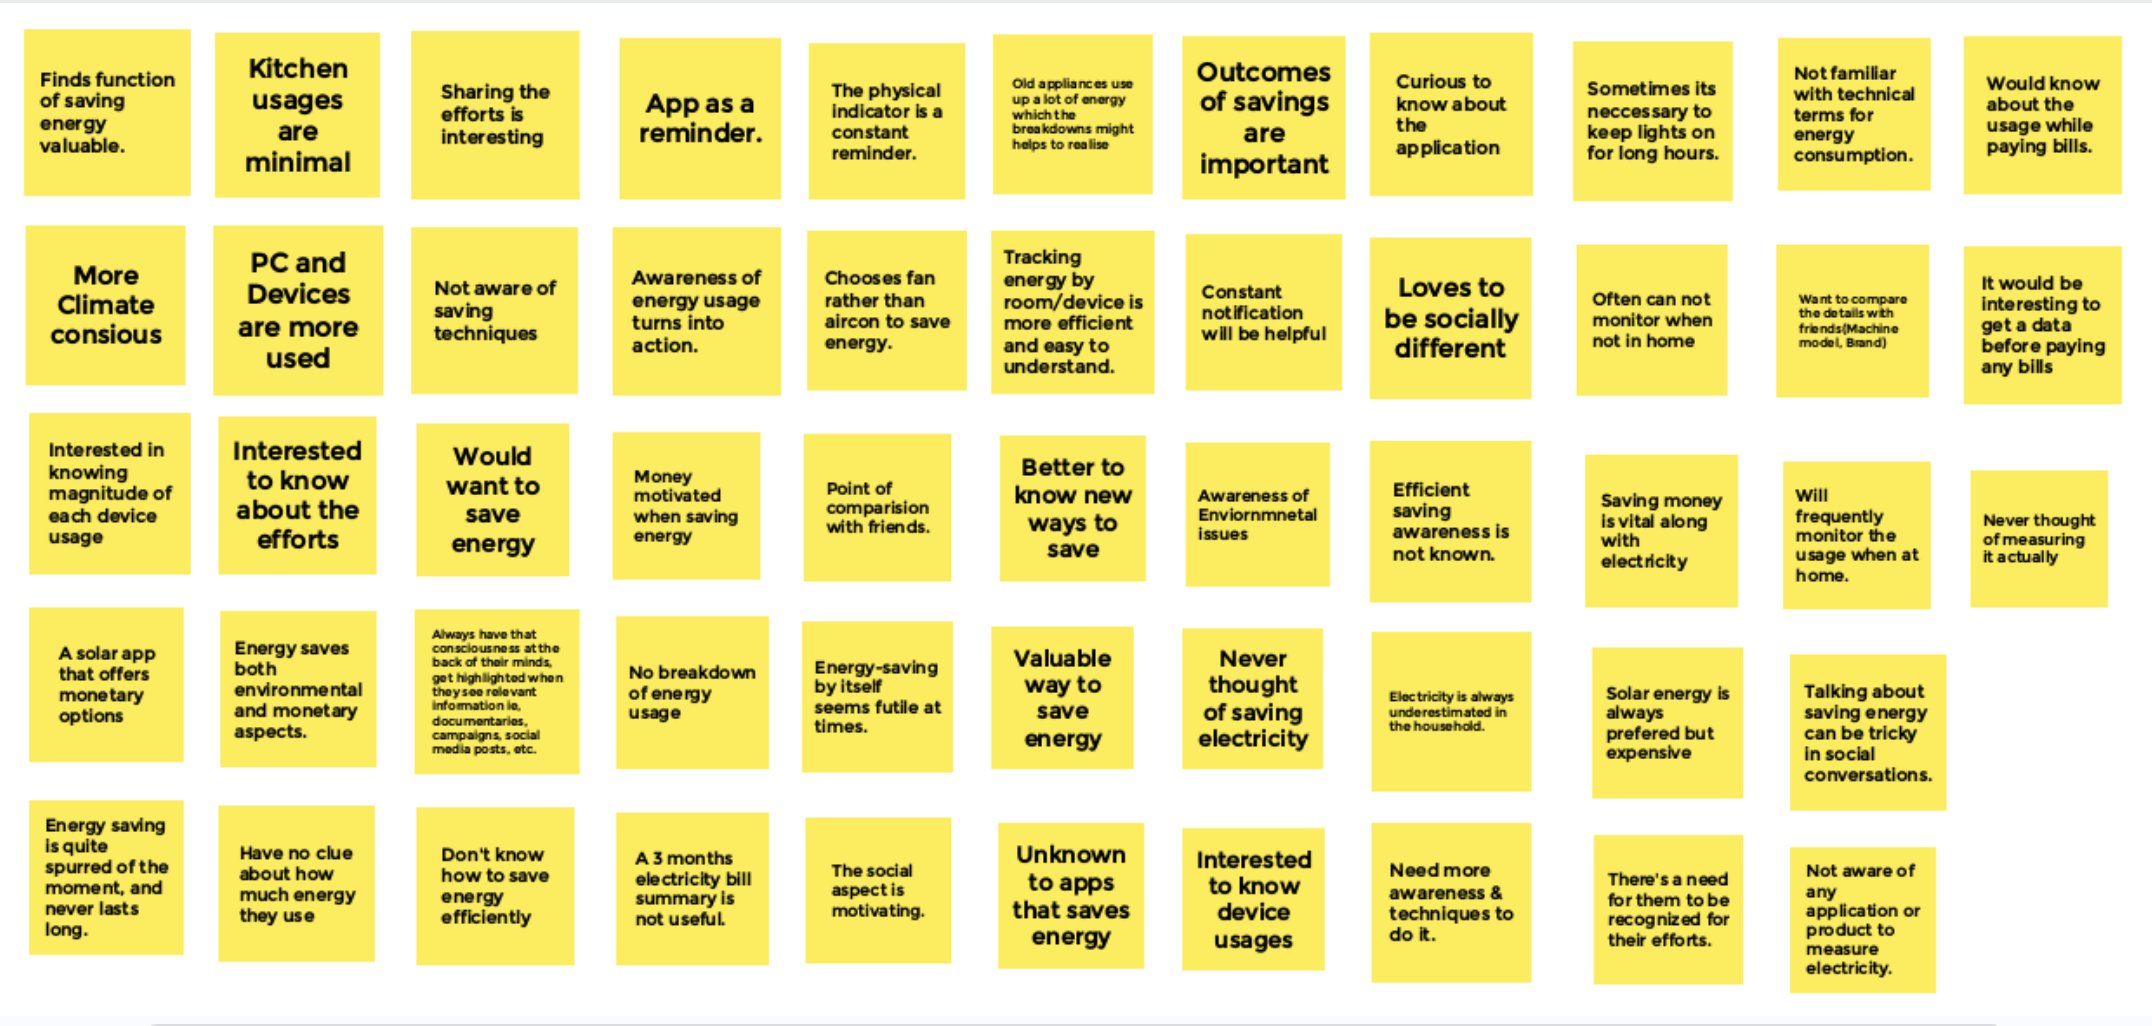
Affinity Diagramming
After collecting all the data, we proceeded to create an affinity diagram to identify and organize key themes. This method enabled us to categorize and cluster related insights, providing a clearer understanding of the findings. Subsequently, we grouped the key insights into five distinct themes: Lifestyle Values, Electricity Usage, Frustrations about energy usage, Current knowledge and actions, and Motivation and triggers to save. These thematic categories served to enhance the research process by structuring data, uncovering patterns, and generating actionable insights. Ultimately, these insights proved invaluable in refining our prototype and driving further enhancements.

Themes
The affinity diagraming uncovered the following themes:
Users often check their electricity usage during monthly payments. "I generally have a look at it when I have to pay my electricity bills at the end of the month, and sometimes my bills are automatically deducted from my bank account."
Users are aware of the facts regarding over-electricity usage but never take any steps to maintain or find a solution. "I always think about it, but I've never really used anything like an app or something. Generally, I just switch it off whenever I find lights or the microwave on. But I know that there are still a lot of times I just forget."
Saving electricity is as valuable as saving any other natural resources for the betterment of the environment."Electricity is also very important, which we always use without much thinking. Actually, it’s always good to save anything that can help the environment."
Users tend to be motivated when they find an emotionally satisfying result for their efforts. "I remember that once when I was small and used to switch off all lights and fans with my parents before going to sleep, that helped us save a lot of money in the end, and my father gifted me a small keychain with that saved money. I was really happy then. It’s a childhood story."
Being aware of how much each device uses can be a motivator for positive change. "It does affect my decision-making. Like I said, I use the fan more than the aircon because I know that the fan is more energy-saving."
Recommendations
To optimize energy usage and foster a culture of conservation, the following recommendations are suggested:
Provide instant notifications based on daily usage and offer suggestions to reduce it.
Encourage sharing the app within close networks to increase awareness.
Share user achievements with peers and colleagues on social platforms, and implement a reward system for continuous motivation.
Sprint 4

Fine-tuning the Outcomes
As we transitioned from the mid-fidelity prototype to the high-fidelity prototype, we began by creating a revised user flow to better outline the steps within the app.
User Flow

Color Palette

Typography

Logo Design & Iconography


Logo
The Solution
Over the course of four sprints, we conducted research, identified a problem space, and fine-tuned the information we collected. We then created various iterations of our proposed solution. Upon successfully completing these steps, we developed our Minimum Viable Product (MVP), 'Power Savers.'
This application addresses the concerns of those who care about the environment and want to contribute to its sustainability and energy conservation. 'Power Savers' is an innovative app that tracks energy usage, visually displaying consumption patterns for easy comprehension, promoting social interaction, and offering incentives for energy conservation. It empowers users to reduce electricity consumption, leading to both financial savings and a sense of fulfilment.

How It Works

Minimum Viable Product
Feature 1: Onboarding Process
As a starting point for the app, we introduce a sequence of introductory screens featuring: Who We Are, What We Do, Your Benefits, Our Vision, and How We Work. The onboarding process seamlessly integrates a straightforward and hassle-free sign-up process for new users.

Feature 2: Personalize Home Preferences
This feature involves selecting the type of house and room types, and then connecting it to your electricity meter via Bluetooth. This connection is facilitated by the Powerpal Bluetooth device.

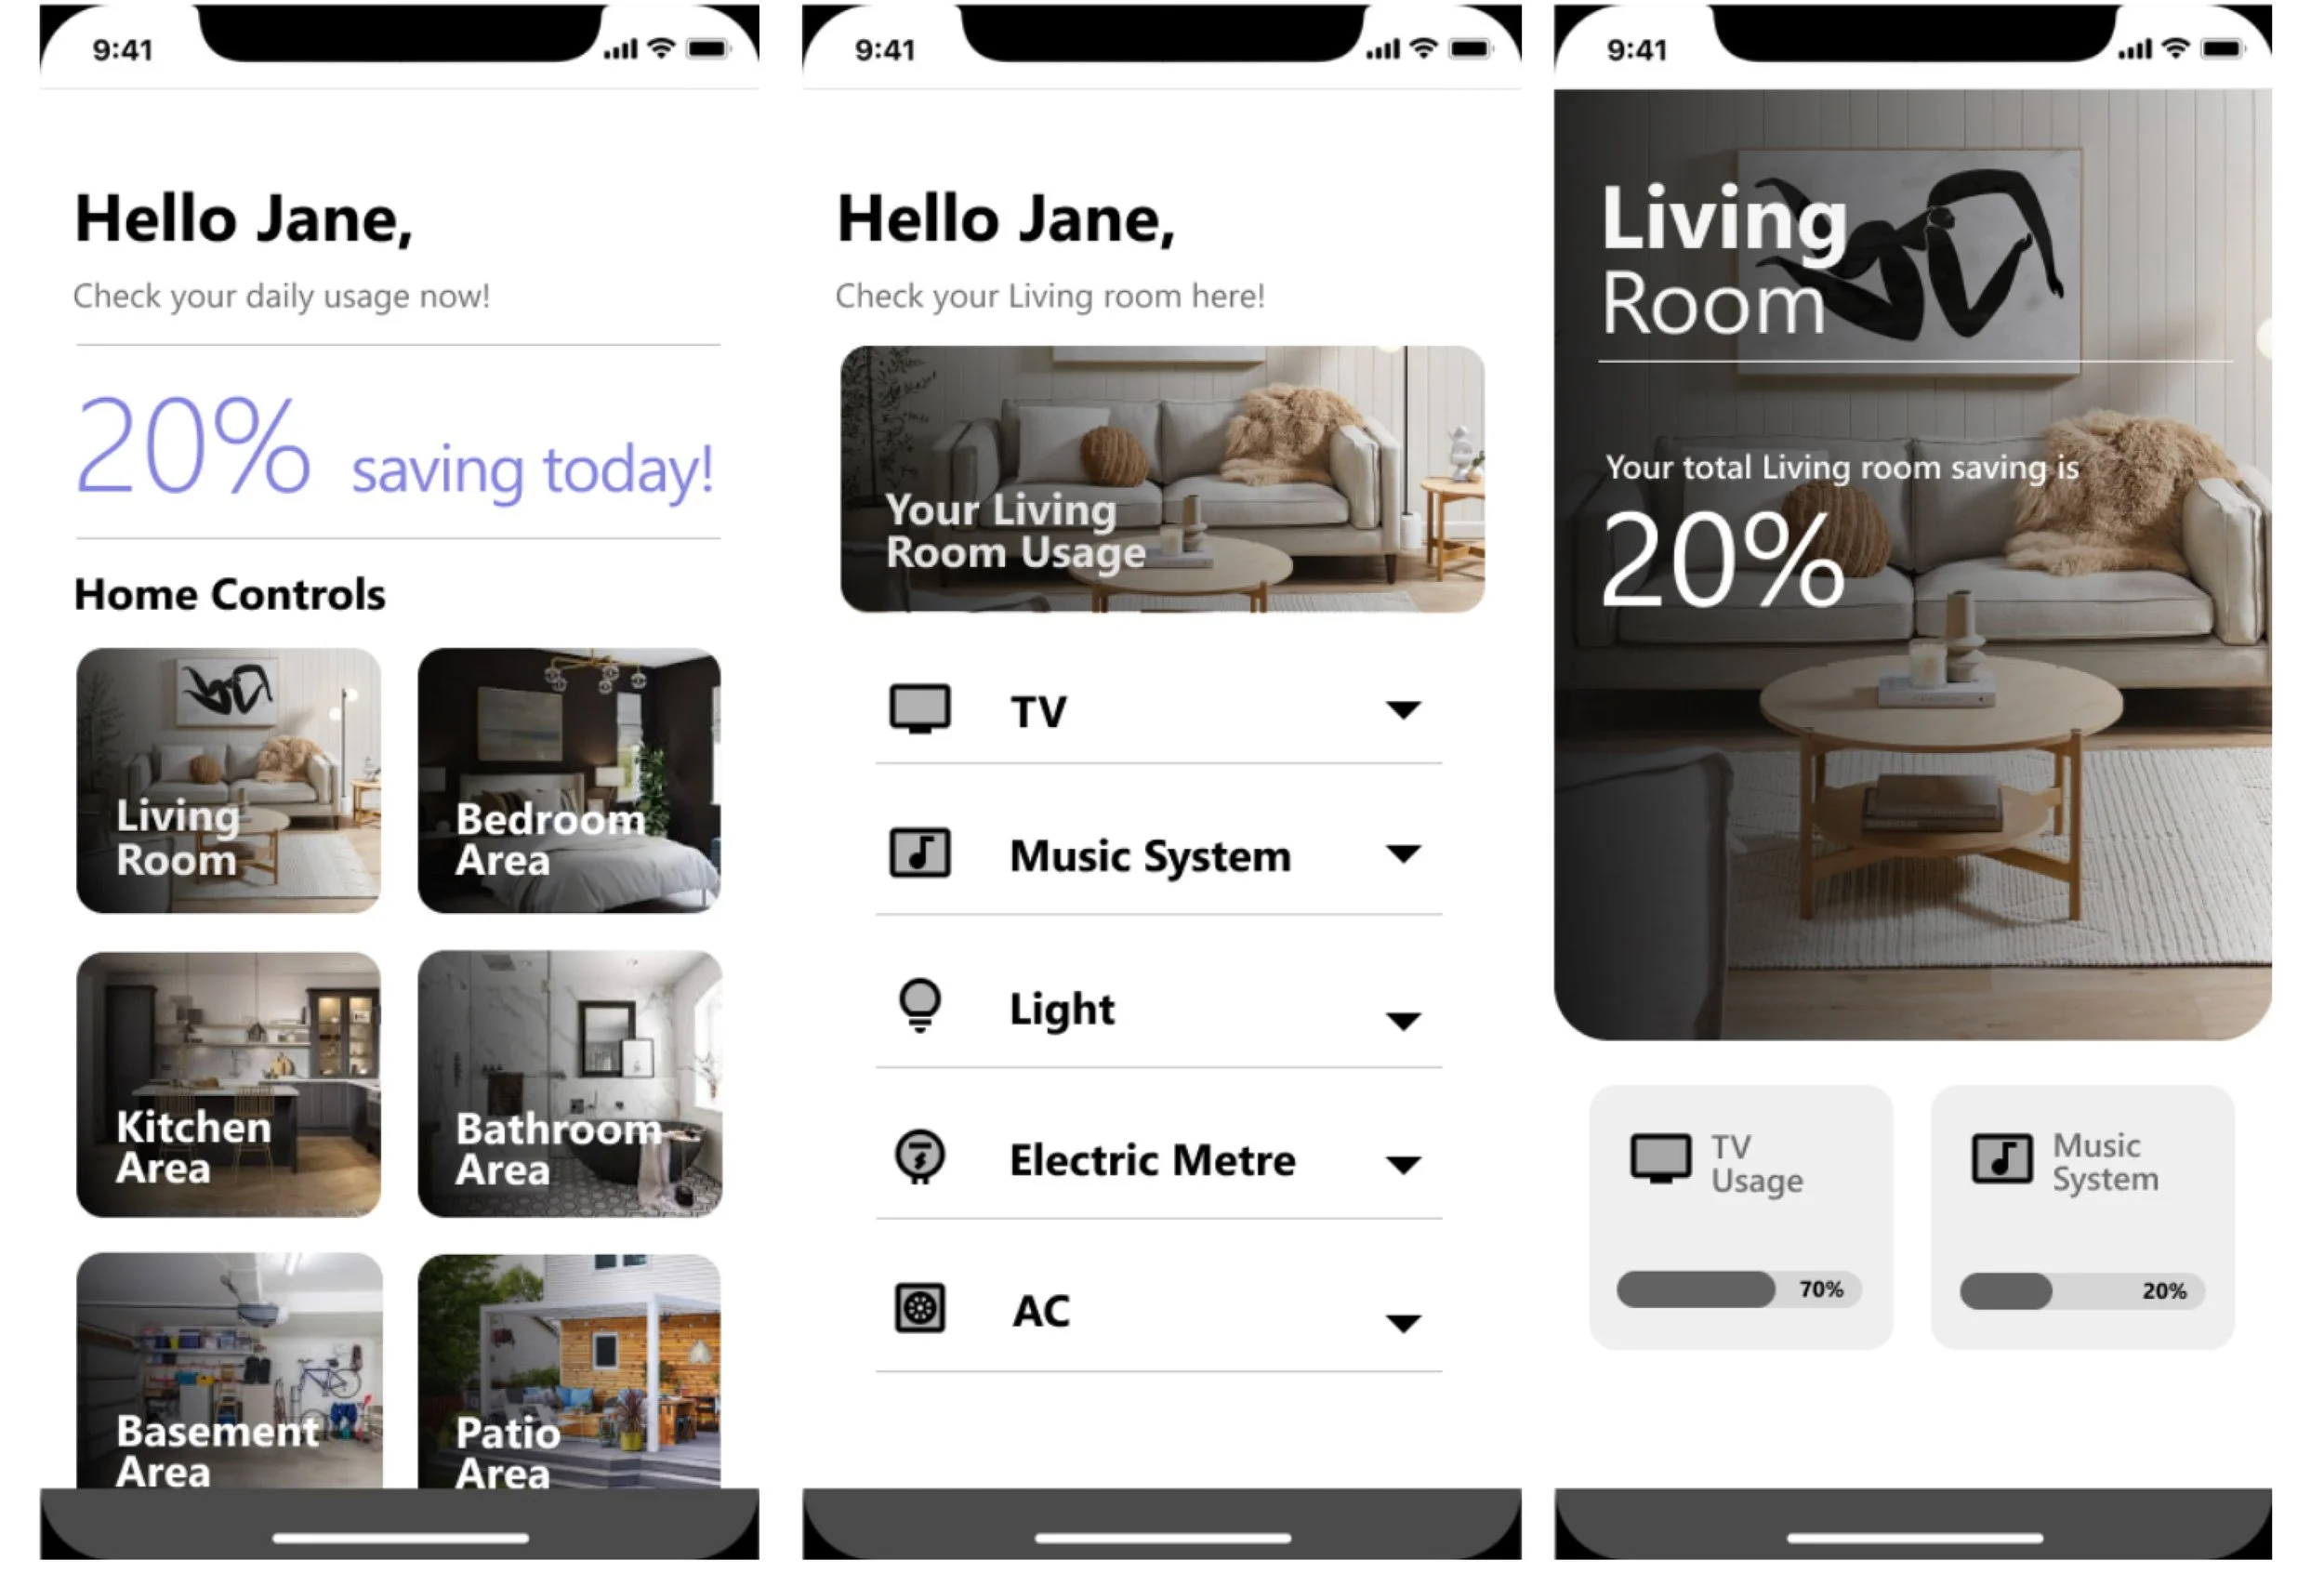
Feature 3: View Real-Time Energy Usage
This feature lets users monitor their real-time energy usage through an intuitive and interactive visual interface.

Feature 4: Setting Power-Saving Goals.
This feature allows setting a preferred energy-saving goal and viewing excess usage by rooms.

Feature 5: Device Management
This feature allows users to add new devices and view all the existing devices they have added.

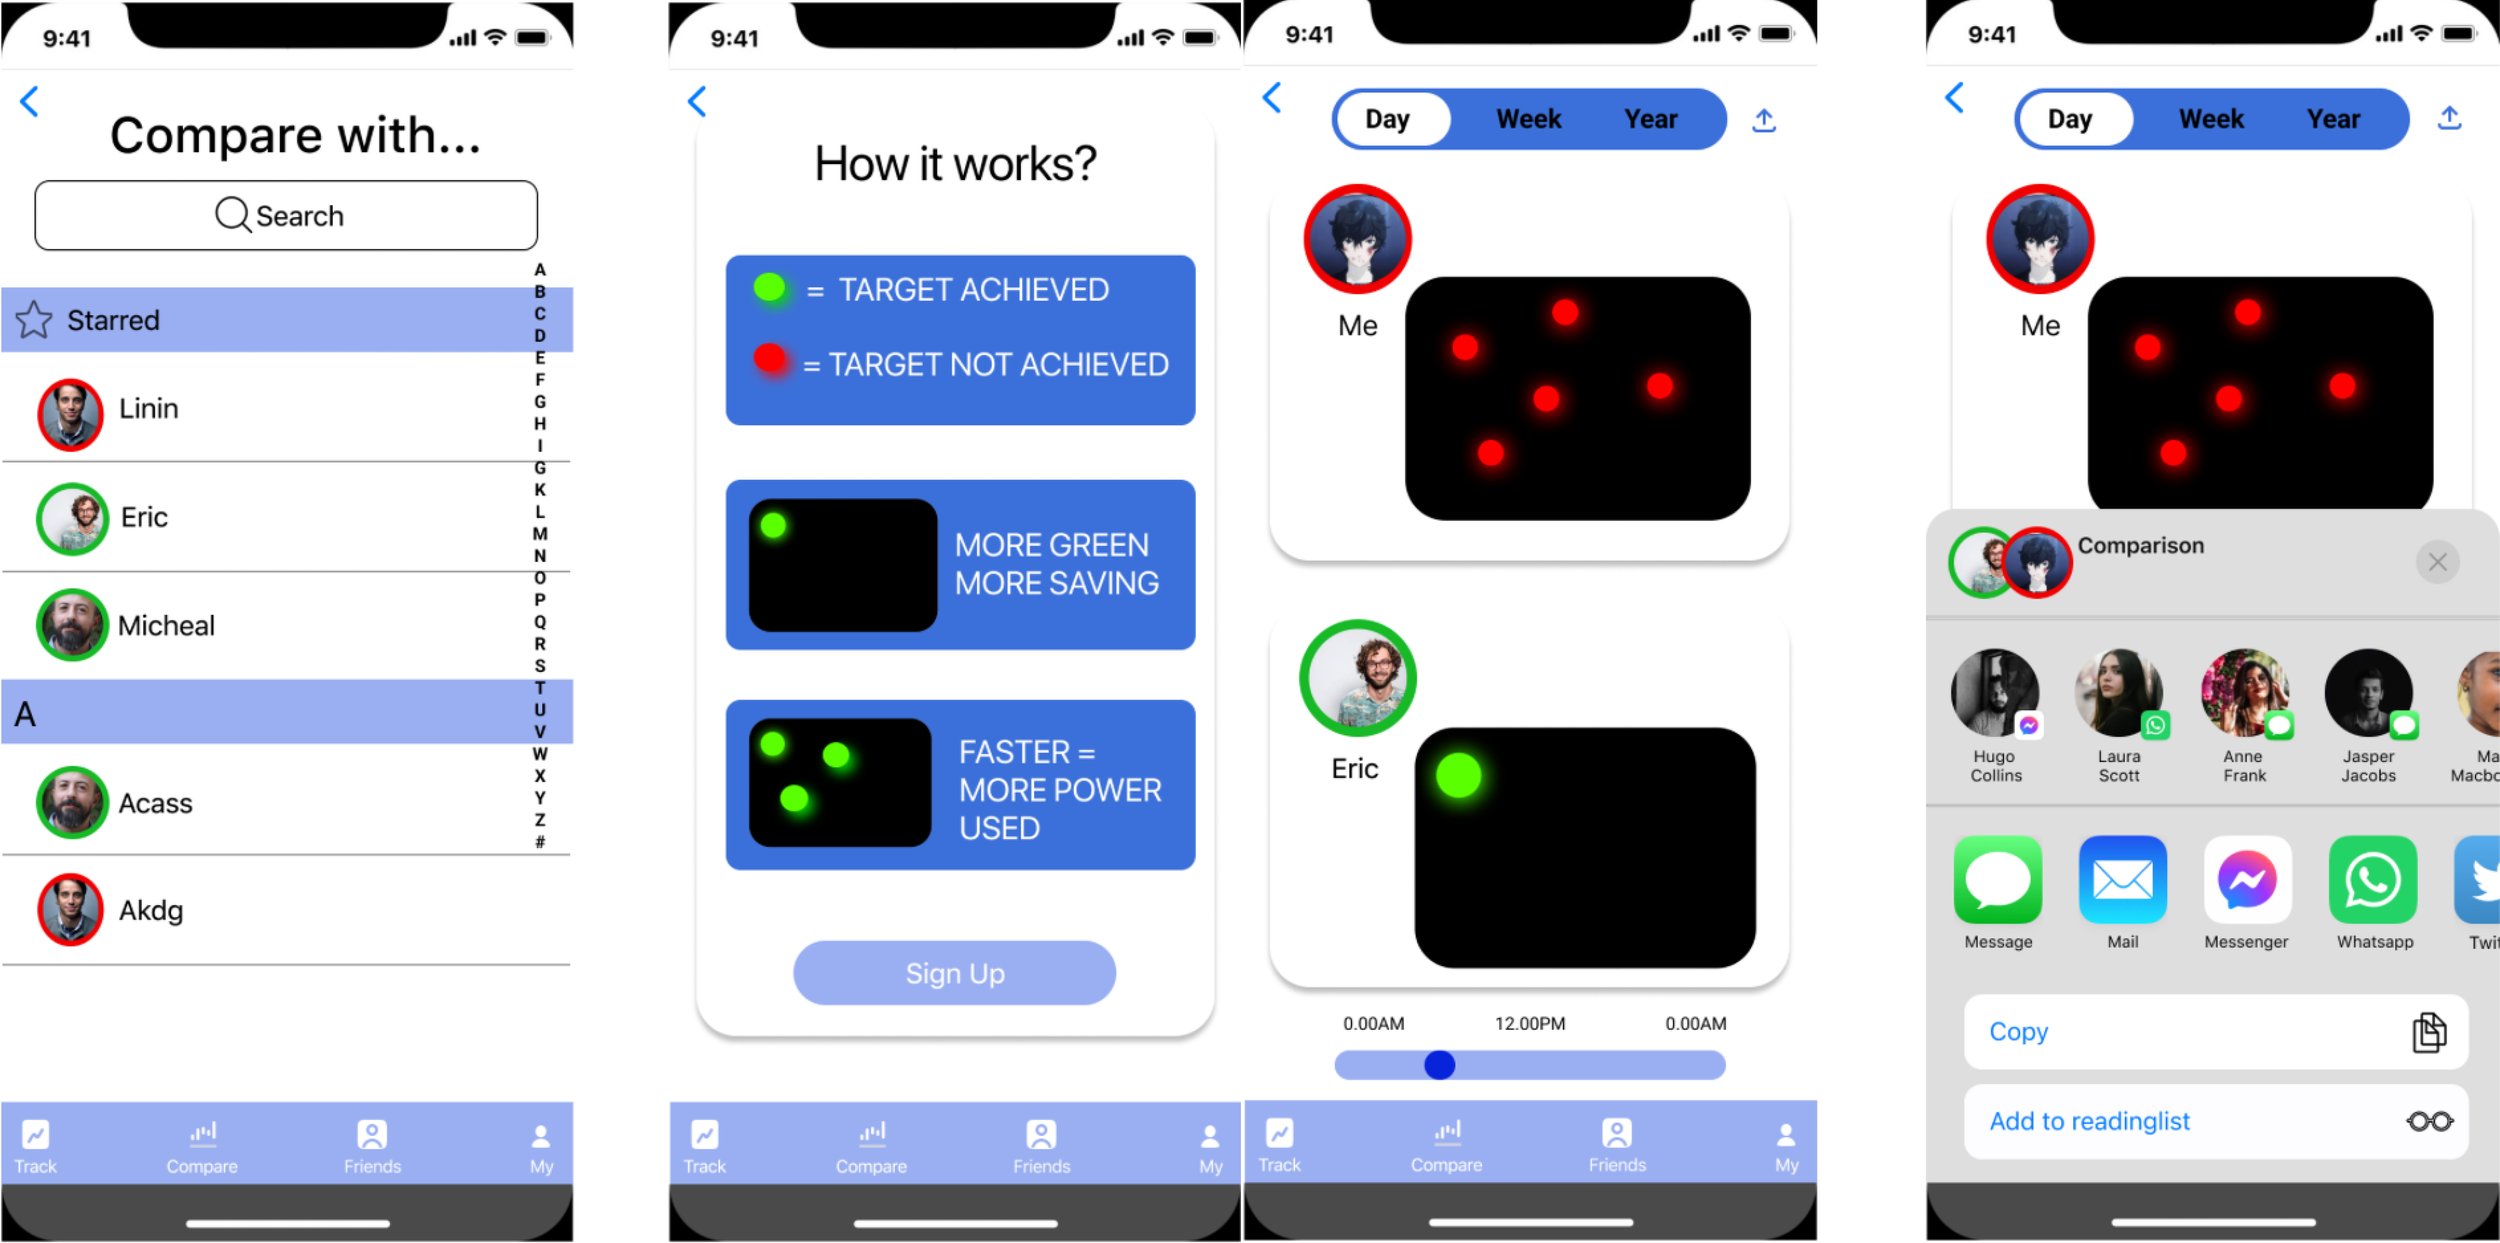
Feature 6: Redeem Coupons, Share and Motivate
This feature allows users to redeem their coupons received. It also allows users to share and compare their results with like-minded people to stay motivated and be a “Star-Saver”.
